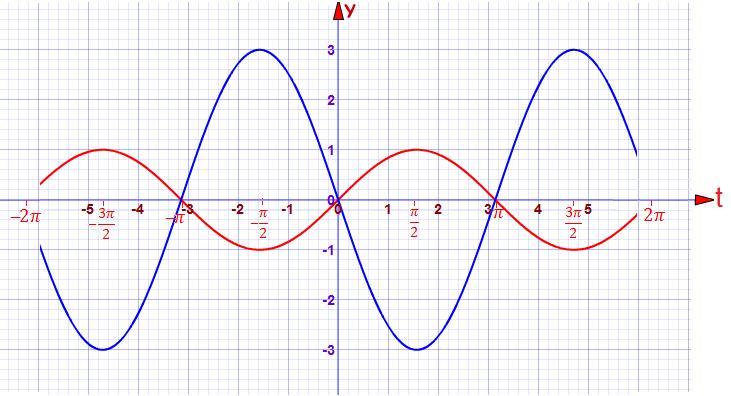
The above shows the graph of the function y = sin(t) in red and the graph of another sine function shown in blue.
What is the equation of the function shown in blue?
A
y = -3sin(t)
B
y = 3sin(t)
C
y = sin(-3t)
D
y = sin(3t)

The above shows the graph of the function y = sin(t) in red and the graph of another sine function shown in blue.
What is the equation of the function shown in blue?
y = -3sin(t)
y = 3sin(t)
y = sin(-3t)
y = sin(3t)